Digital, social and mobile is our day-to-day. It's normal, we've embraced them all, it's how we live. It wasn't like that a few years ago, and it certainly wasn't the norm for businesses but companies today are realising that without digital, they will simply cease to exist.
Realising this is one thing; taking action and actually transforming every level of a business is something different.
But it's becoming inevitable. Businesses have to react and act as technology is disrupting every aspect of our economy and society. They need to be on top of this now because we as consumers require it; this is how we lead our lives, with digital, social and mobile at our fingertips all the time.
To put some pressure on you, I want to show you some stats about social, digital and mobile from this year's research by We Are Social.
I reviewed the same study in 2014 so today we are going to look at 2016 and compare what's happened in two years. A few additional things have been added since then such as the share of web traffic which I find very interesting and useful.
Just as the old post, this one focuses on Germany and the UK as the markets I am professionally and personally most interested in.
Social, Digital and Mobile Global Snapshot 2016
Before I get to the details for each country here are some overall global statistics that I found fascinating and want to compare with 2014:
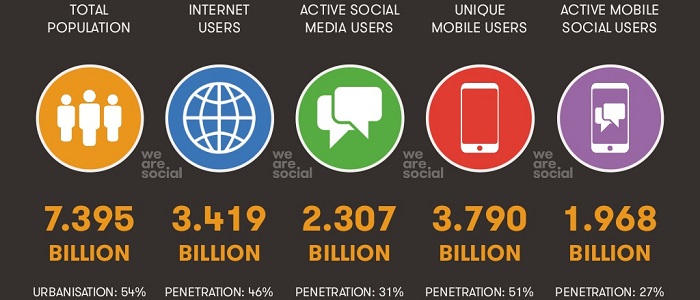
- Of the 7.395 billion total world population, there are ca. 3.42 billion internet users today or 46% of the world’s population (that was 35% in 2014).
- 2.3 billion or 31% of the world’s population are active social media users (that was 1.8 billion or 26% in 2014).
- 3.8 billion or 51% of the world’s population are unique mobile users (wasn't tracked in 2014).
- 1.9 billion or 27% of the world’s population are active mobile social users (wasn't tracked in 2014).
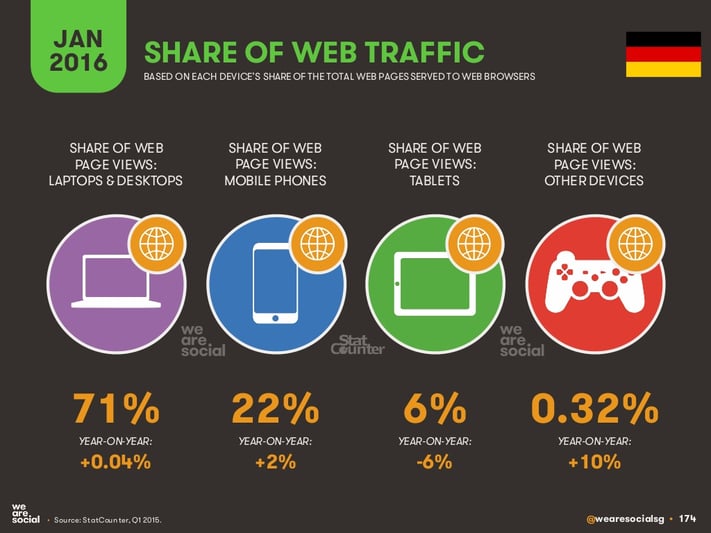
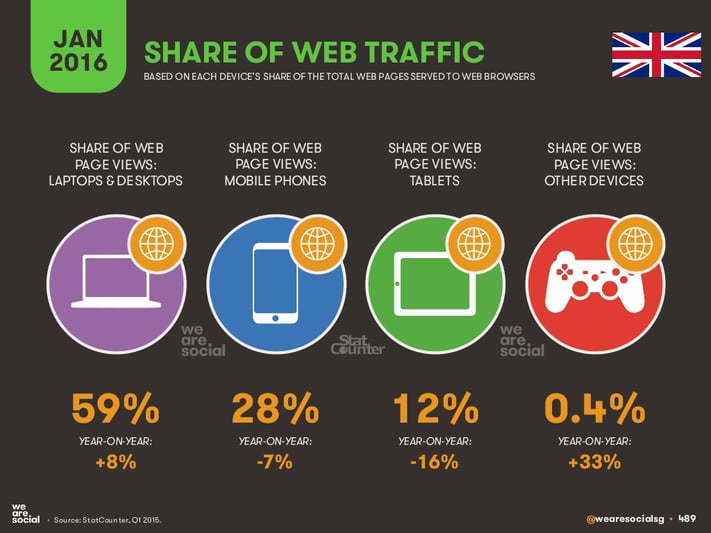
- Mobile's share of web traffic has grown from 28.9% in 2014 up to 38.6% in 2016.
- Mobile social users have grown by 17% since 2015 which the fastest growth in contrast to internet users (10% growth), social media users (10% growth) and mobile users (4% growth).
- The most social media and mobile users are in East Asia, far, far surpassing the rest of the world.
Key 2016 Social, Digital and Mobile Stats and Indicators for Germany
- Internet penetration: 89% (84% in 2014)
- Average time users spend on the internet per day: 3h 20 min on laptop/desktop, 1h 21 min on mobile device, 1h 9 min on social media on any device.
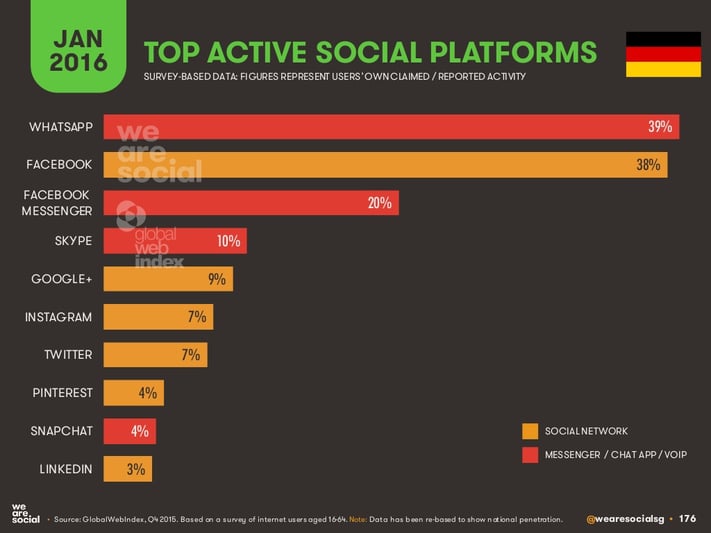
- Xing is not among the top social networks (kinda of shocking!).
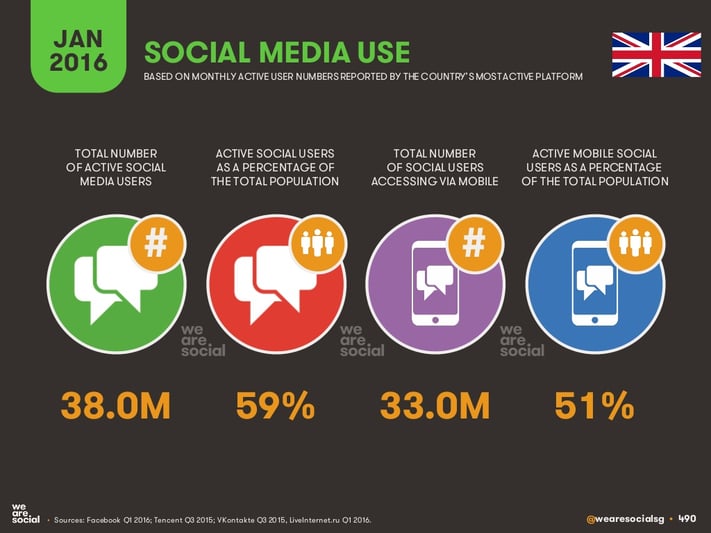
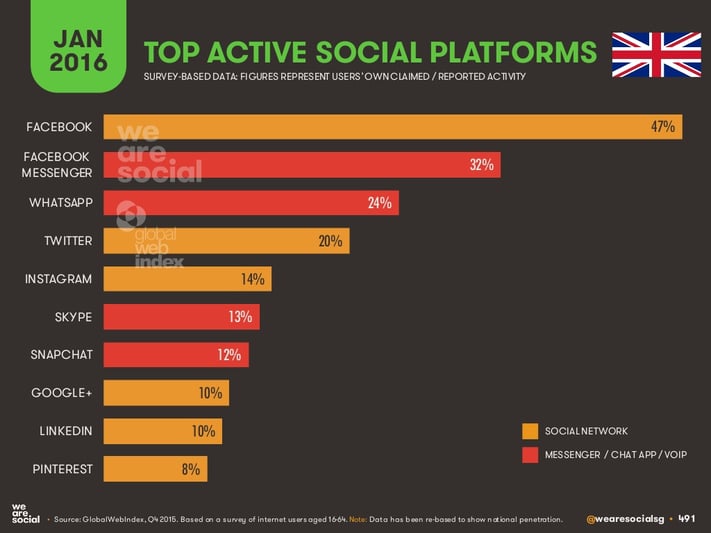
Key 2016 Social, Digital and Mobile Stats and Indicators for the UK
- Internet penetration: 92% (87% in 2014)
- Average time users spend on the internet per day: 3h 47 min on laptop/desktop, 1h 33 min on mobile device, 1h 29 min on social media on any device.
- Facebook is very big in the UK. No I know what you mean, Stephen Waddington, and I understand your fascination with it.
Social, Digital and Mobile Stats and Indicators for the Rest of the World:
I do urge you to read the full report in the SlideShare I'm embedding here. There's so much in there that you are going to find extremely useful; it's an impressive research!
The rest of the countries you'll find in the Digital Yearbook, e.g. Ireland, Sweden, Switzerland and more.
Which were the most important statistics for you?
Images from the Slideshare presentation


